Her values

Data & Trends

What the sensors recorded about Pebbels' final months β€” honestly, with all the gaps and all the lows.

These curves are real β€” straight from Pebbels' sensors, over around eight months and more than 38,000 readings, nothing smoothed, nothing prettied up. The gaps are part of it too: in the good weeks she wore no sensor (also a matter of cost). That is precisely why the data tell honestly how her illness progressed β€” and why, in the end, the right technology made the difference.

The long view

The final months

From September 19, 2025 to May 25, 2026 β€” almost eight months without a break. A stable autumn, a sharp drop in March, recovery again in April, then the final crash. The gaps are not missing data in the bad sense β€” they were the good phases without a sensor.

Pebbels' glucose curve over almost eight months, colour-coded: red without tablets, green the stable time on tablets, red again at the end when they no longer worked; with the stations at the Elversberg veterinary clinic

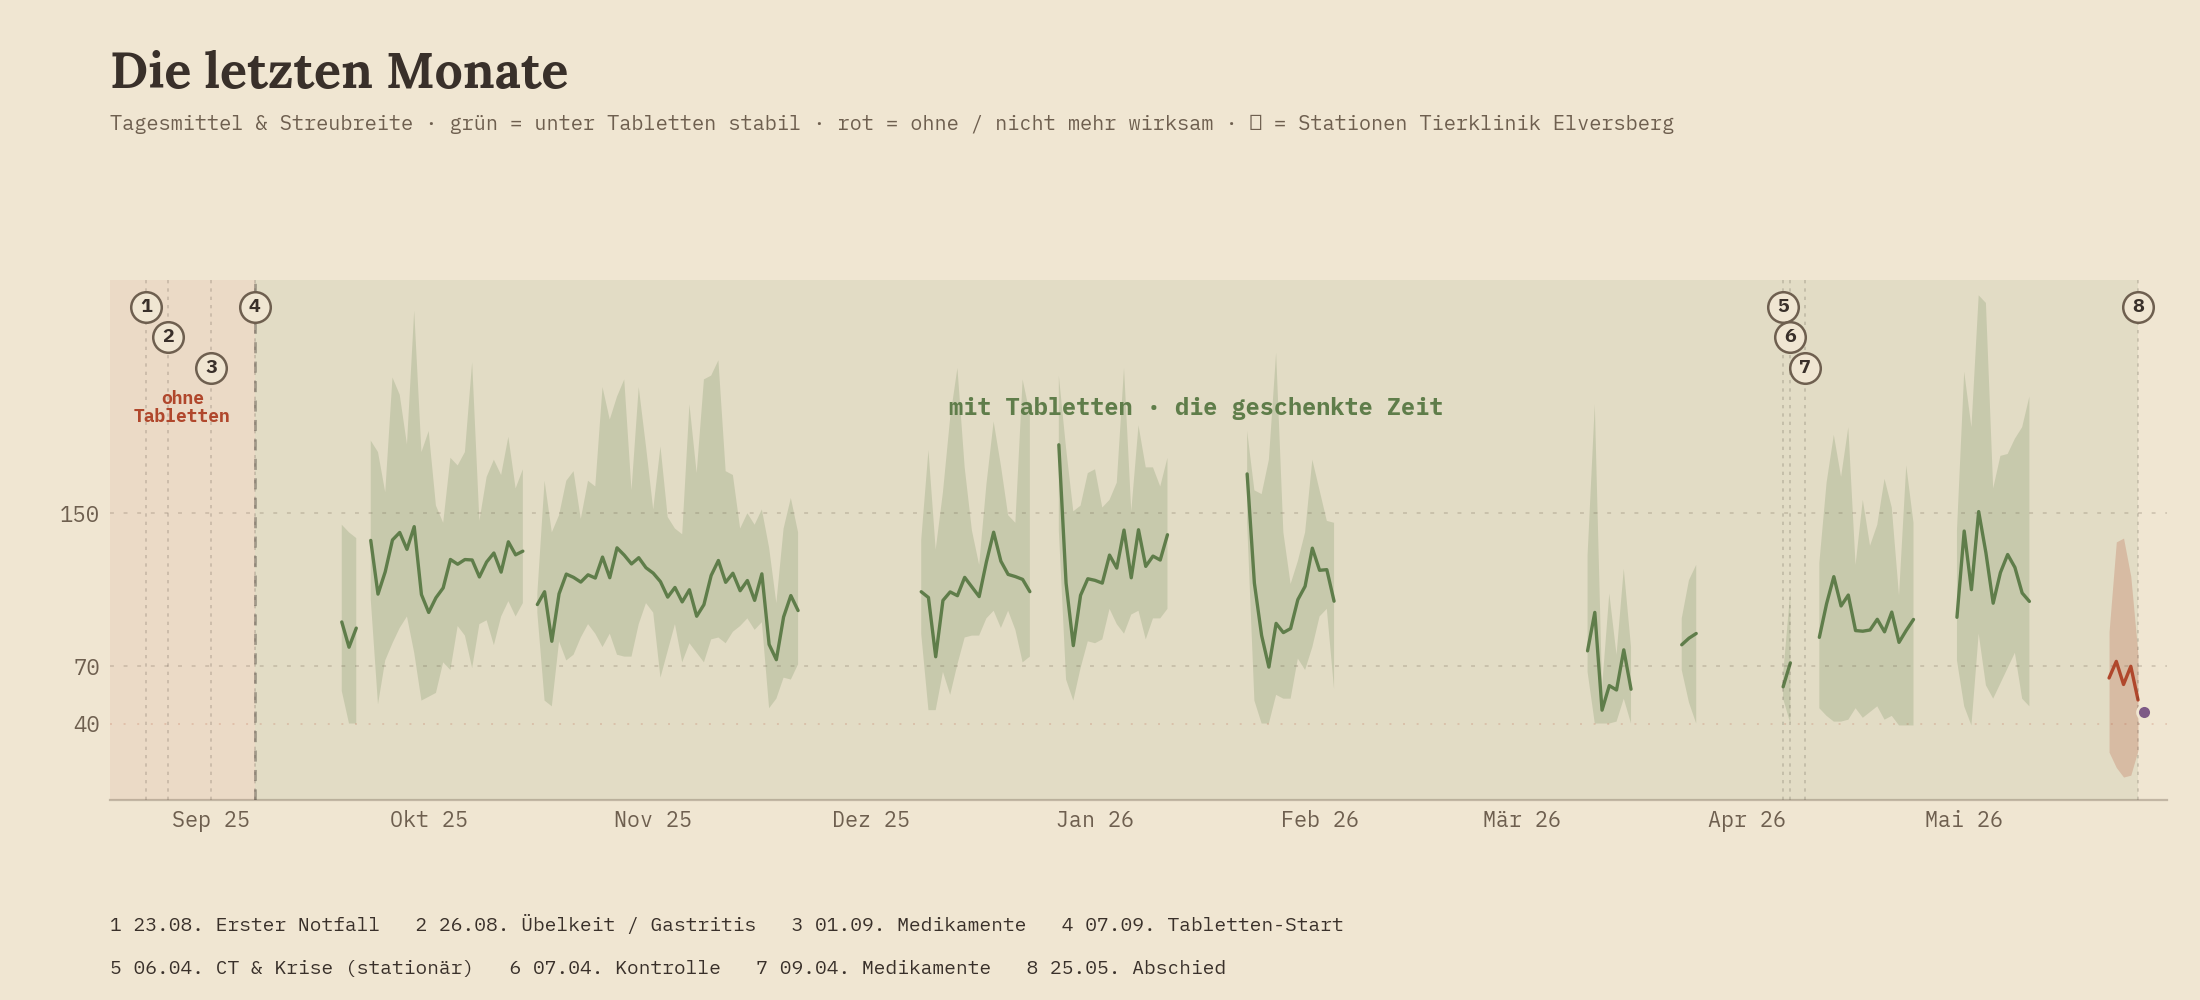
The colours separate the phases: red on the left = without the tablets (adjustment & emergencies), green = the stable time on Proglycem from September 7, 2025 β€” which extended her life β€” and red at the end, when the tablets no longer worked. The numbered points 1–8 are the stations at the Elversberg veterinary clinic (legend below the graph): from the first emergency through the start of tablets to the farewell.

The close view

The final days

Zoomed in on May 21 to 25. Every spike a battle β€” for days her blood glucose stayed almost entirely below the normal range, with ever deeper drops. On Whit Monday, at 8:04 p.m., the recording ends.

Pebbels' glucose curve, May 21 to 25, 2026 β€” mostly below the normal range, ending on May 25 at 8:04 p.m.

Recorded with the Pebbels APP β€” the line Patric watched day and night.

In numbers

Month by month

"Time in range" (70–150 mg/dl) is the most honest gauge β€” and it tells the whole story: a calm autumn above 85%, the drop in March to 35%, a last recovery in April, then the end.

Bar chart: time in range per month β€” from 76% in September 2025 through 91% in November to the drop to 35% in March 2026 and 56% in May

In February she wore almost no sensor at all β€” she was doing well then. March shows the great crisis.

Sensor comparison

What the sensors showed

Comparison of the reading distribution: Libre 3 (lowest value 40), Dexcom (39), Pebbels app (12)

Three sensors, three pictures. Over seven months and 30,674 readings, the FreeStyle Libre 3 never showed a value below 40 mg/dl β€” its built-in floor. It does not report values below that, and during prolonged hypoglycemia it shuts off. Precisely when it counts.

Dexcom captured the lows down to 40 (and flagged "Low" 13 times). The Pebbels app reads the raw sensor value and showed the true lows all the way down to 12. With a disease that turns on the lows, this difference is everything.

Note: Libre (until April 7) and Dexcom (from April 11) run directly back to back; the app values come from the final days. The floor effect on the Libre matches the manufacturer's specification and our own experience.

What the data show

Conclusions

β†˜

The illness came in waves

Eight months documented: a stable autumn (Oct–Dec 86–91% in range), a sharp drop in March to 35%, recovery again in April β€” then the final crash. The valleys grew deeper, the good phases shorter.

β–Ό

The final days β€” one continuous low

On average 64 mg/dl, 62% of the time below 70, 41% below 54, the lowest value 12 β€” despite every measure. The body could no longer counter-regulate.

⊘

The medication lost its grip

Weeks earlier, a 100 mg tablet still drove the glucose up to ~300. In April the maximum was 264, in the final days only 137. The same therapy, ever weaker effect.

β—‰

The sensor decided what you saw

Over seven months and 30,674 readings, the Libre never showed a value below 40 β€” its built-in floor. Dexcom and above all the Pebbels app made the true lows visible, all the way down to 12. You can only treat what you can see.

Note: This is an honest evaluation of Pebbels' own measurement data β€” not a universally valid study and not veterinary advice. Every course is different.